There’s two main types of air pollution – indoor air pollution, and outdoor air pollution.
This guide focuses on outdoor air pollution (also called ‘ambient air pollution’).
We look at what outdoor air pollution is, along with potential causes, sources, examples, effects/impact, and potential ways to reduce it.
Summary – Outdoor Air Pollution
What Is Outdoor Air Pollution?
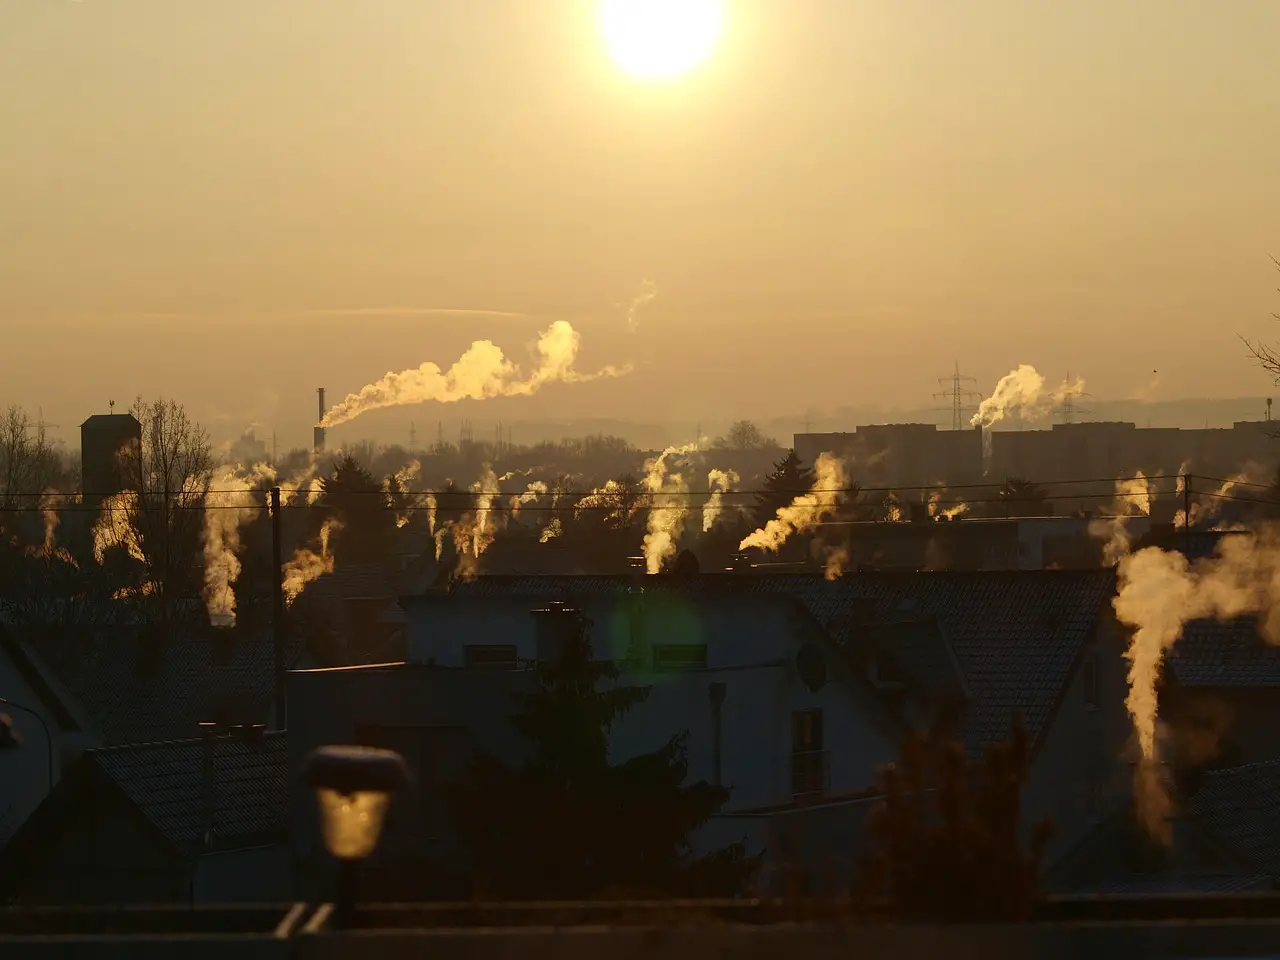
Outdoor air pollution is the release of harmful substances into the outdoor air/atmosphere
Variables To Consider For Outdoor Air Pollution
Some of the variables to consider with outdoor air pollution might include:
– The concentration of each type of air pollutant in the air
– The sources that different pollutants come from
– The geographic area where air is polluted
– The type of area – air pollution can particularly be heavy around cities and heavily populated areas compared to rural areas and less populated or less populated areas
– Developed vs developing regions – sources of air pollution can differ in these places
– Industrialised vs less industrialised regions – sources of air pollution can differ in these places
– The time over which air pollution is measured. Air pollution can vary from day to day, and year to year in different geographic locations
– Whether or not measures are implemented to reduce air pollution in a city or town
– Weather can play a role in air pollution levels – winds for example can blow pollutants in and out of an area
– We list some other factors and variables that impact or change air pollution and air quality in this guide
The Different Major Air Pollutants
Some of the major air pollutants are PM10 and PM2.5 (Particulate Matter), Ozone, Nitrogen Dioxide, Carbon Monoxide, and Sulphur Dioxide
In the guide below, we have profiled each pollutant, including what each one, what they are made of, what sources they come from, whether they are trending up or down in the US and other countries, and effects
Directly Emitted vs Indirectly Formed Air Pollutants
Outdoor air pollutants can form in different ways
Some pollutants are emitted directly and these are called primary pollutants. We list the main outdoor air pollutants in the guide below
Other pollutants are formed indirectly from primary pollutants, and other atmospheric compounds, and these are called secondary pollutants.
We give some examples of how some secondary pollutants form in the guide below
Human Sources Of Outdoor Air Pollution
Some data suggests human sources are the main cause of outdoor air pollutants
What the main source of air pollutant is depends on the type of area – cities might have more pollutants come from transport, and developed countries might have more pollutants come from transport and power generation and industrial activity
One of the main human source of outdoor air pollution is the combustion of fossil fuels (coal being one example, as well as natural gas, and oil) – in the generation of electricity industrial activities, the operation of vehicles/cars, and so on
Waste management and agriculture are two other potential common sources
Natural Sources Of Outdoor Air Pollution
Air pollutants can also come from natural sources
Just a few examples are dust storms from open spaces of land without vegetation (which blow up dust), wild fires and forest fires, and volcanic activity
We list more in the guide below
Each Type Of Air Pollutant Can Come From Specific Sources
Although air pollution sources can be generalised when considering all pollutants, each individual pollutant may come from specific types of sources too
In the guide below, we list the most common sources of emission for PM10 and PM2.5 (Particulate Matter), Ozone, Nitrogen Dioxide, Carbon Monoxide, Sulphur Dioxide, and VOCs
Pollution From Container Ships & Super Ships (Compared To Cars & Road Vehicles)
Multiple reports indicate that super ships are a major emitter of noxious oxides – as much or more than all the world’s car fleet put together.
It would be interesting to also examine the amount of carbon and black carbon these super ships emit compared to road vehicles, separate to sulphur pollution and noxious oxide pollution
Indoor Air Pollution Contributing To Outdoor Air Pollution
It’s also possible that air pollutants that originate indoors may find their way into the outdoor air and contribute to outdoor air pollution i.e. pollutants originate from indoor sources
Potential Impact Of Outdoor Air Pollution On Human Health
The potential impact of outdoor air pollution on human health includes the general impact, and the impact of each specific pollutant.
The pollutant profiles in the guide below outline the effect on human health each pollutant might have.
The general impact of air pollution on human health might include:
– Links or attribution to death
– Links or attribution to health conditions, diseases, and impairment of body function
– Specific groups may be more vulnerable than others
– Sometimes there’s no effect of pollutants on human health
Some sources indicate that about 80% of total outdoor pollution related premature deaths (about 3.8 million a year) are related to heart disease and stroke, with the remainder from respiratory illnesses and cancers
There’s some question over how strongly premature deaths can be linked or attributed air pollution – because air pollution exacerbates pre-existing cardiorespiratory illnesses and other conditions
So, the question might be how much air pollution really contributes to premature death in these people – is it significant, or not significant?
How strong is the attributable link? Why, or why not?
Additionally, what impact does different concentrations of air pollution really have on healthy people without pre-existing health problems?
Some reports may question how much harm exactly is attributable to air pollution.
Some argue that it’s too difficult to a) link air pollution and health conditions or mortality, and b) separate pre existing conditions and the impact of air pollution caused by coal power plants, or even smog from vehicles.
In addition, some reports even claim that pollution from sources like fossil fuels is overstated or over exaggerated in some cities and regions.
One organisation highlight air pollution as the greatest environmental risk to human health right now (but a changing climate may be the biggest risk in the future)
Most Harmful Outdoor Air Pollutants
Particulate matter might be linked to the most premature deaths of all pollutants right now i.e. it might be the most harmful
Fine particulate matter (PM2.5) in particular might be of most concern
Some of the cities currently with the worst PM2.5 pollution levels are in India
Ground-level ozone is another air pollutant that can contribute to some health issues
People Who Are Impacted By Both Outdoor Air Pollution & Indoor Air Pollution
Some people in some areas, cities or countries in the world may suffer the effects of both indoor and outdoor air pollution because of where they live.
Read more about the areas of the world where indoor air pollution is most prevalent in this guide, and cross check it with the areas that have the most outdoor air pollution
Are More Premature Deaths Linked To Outdoor Air Pollution, Or Indoor Air Pollution?
Several sources indicate that outdoor air pollution exposure contributes to/is linked to more premature deaths than indoor air pollution exposure right now.
Environmental Impact Of Outdoor Air Pollution
There may be a range of ways air pollution impacts the environment, or contributes to environmental issues.
Contribution to acid rain may be one example.
Impact Of Outdoor Air Pollution On The Economy
Outdoor air pollution may be responsible of the loss of trillions to the world economy per year according to some estimates.
Productivity losses, and degraded quality of life are given as a few of the main reasons why.
Other Impacts Of Outdoor Air Pollution On Society
There’s a range of other potential impacts or outdoor air pollution on society, such as contribution to other environmental issues not mentioned in this guide, which can also impact wildlife and microorganisms.
There’s also the aesthetic look of smog in the air in some cities, which can be undesirable for some.
Relationship Between Agriculture & Outdoor Air Pollution
In the guide below, we outline how agriculture might release compounds that contribute to the formation of air pollutants, whilst at the same time agriculture and food production being negatively impacted by air pollutants
What Share Of Cities Worldwide Have ‘Unacceptable Levels’ Of Polluted Outdoor Air?
Estimates can vary.
Some estimates indicate that only about 10 to 20% of cities worldwide have acceptable air quality levels (within guidelines levels) when it comes to particulate matter concentration in the air.
It’s also worth noting that when looking at all forms of air pollution (indoor and outdoor), majority of pollution-related deaths were in Asia – South, Southeast and East Asia in 2016
Cities & Countries With The Most Air Pollution
Indian cities, followed by Chinese cities may be some of the most polluted in terms of PM2.5 concentrations
Pakistan, parts of Africa, parts of the Middle East, and parts of South East Asia may also have cities with higher than average air pollution when it comes to PM2.5
There’s a list of cities and countries that may be some of the least polluted in the guid below too
It’s worth noting though that these lists can change over time as cities pollute more, or make efforts to pollute less (or clean up air quality)
Some cities, countries and regions in the world are far more polluted and have much worser air quality than others (for various reasons)
India, Pakistan, China, and parts of Africa feature in the top countries and regions in the world for particulate matter (PM) air pollution levels
US States With The Most Air Pollution
In this guide, we look at the US States which might have some of the most and least polluted air.
At the time of writing the guide, according to the data we looked at, California ranked as a State with some of the highest air pollution levels, and New Hampshire ranked among the lowest.
The Air Quality Index
Real time air quality indexes can give an idea of the concentration of a particular air contaminant in a particular geographic area, on a particular day.
Each locale/geographic area (like a city) generally has it’s own Air Quality Index which provides real time updates of the conditions of the air (and the concentration of a particular air contaminant in the air)
Read more about Air Quality Indexes and what they measure in this guide.
How To Potentially Reduce Outdoor Air Pollution
Ultimately, each city or town will have to have their own strategy and set of solutions for reducing air pollution, and they might focus specifically on the individual pollutants that are found in the highest concentrations in their air
For example, if PM2.5 is found in the highest concentration and has the most significant impact on the population, they may focus specifically on reducing this pollutant
Apart from that, there’s a range of general solutions that might be implemented to reduce air pollution
Electricity generation, industrial activity, and transport might be three of the most common areas to focus on to reduce pollutants from
Using cleaner energy and cleaner fuel sources may be some main solutions
We’ve provided a list of potential solutions in the guide below
Cities That Have Already Reduced Air Pollution
There are cities worldwide that have already implemented different solutions and strategies, and have seen a reduction in outdoor air pollution.
We list the cities, and solutions they implemented in the guide below.
Outdoor Air Pollution Trends Over Time – Increasing Or Decreasing?
Overall, total global deaths attributable to outdoor air pollution have increased in the last few decades, but because the world population has increased over the same time, death rates have actually decreased across countries of all income levels by some estimates of up to 50%
An exception to the above might be some low to middle income cities
Having said that, these are numbers on overall air pollution. Separate to that, each pollutant can increase and decrease in different cities over time
Outdoor Air Pollution Is Separate To Some Other Atmospheric Issues
It’s worth noting that outdoor air pollution is it’s own atmospheric issue, separate to other issues like greenhouse gas emissions and a changing climate.
We actually give examples of the different greenhouse gases in the guide below, and note how they are upper atmosphere gases.
What Is Outdoor Air Pollution?
Outdoor air pollution might be broadly (and unoffcially) described as:
The release of harmful substances (such as gases), particles (organic and inorganic) and/or biological molecules into the outdoor air/atmosphere
Primary Outdoor Air ‘Pollutants’ (Main Types Of Air Pollutants)
Primary outdoor air pollutants are emitted directly from a source.
The primary outdoor air pollutants are:
Particulate matter (PM10, & also PM2.5) (small suspended particles of varying sizes)
Sulphur dioxide (SO2)
Nitrogen dioxide (NO2)
Ozone (O3)
Carbon monoxide (CO)
And, volatile organic compounds (VOCs)
Secondary Outdoor Air Pollutants
In comparison to primary pollutants, secondary air pollutants form from primary air pollutants.
The react, mix, or interact in some way with each other, or with other atmospheric compounds to form.
Examples of secondary pollutants forming are …
Oxidation of SO2, usually in the presence of a catalyst such as NO2, forms H2SO4, and thus acid rain
Particulates created from gaseous primary pollutants and compounds in photochemical smog
Ground level ozone (O3) formed from NOx and VOCs
Peroxyacetyl nitrate (C2H3NO5) – similarly formed from NOx and VOCs
– wikipedia.org
One other example:
… SO2 and NOx can react in the Earth’s atmosphere to form particulate matter (PM) compounds
– OurWorldInData
Outdoor Air Pollutants vs Greenhouse Gases – There’s A Difference
Outdoor air pollution and a changing climate are different issues
With that being the case, there’s a difference between outdoor air pollutants, and (upper atmosphere) greenhouse gases.
Greenhouse gases (upper atmosphere gases) include:
– Carbon dioxide (CO2)
– Methane (CH4)
– Nitrous oxide (N2O)
– Ozone (O3)
– Synthetic gases like CFCs and HFCs
Outdoor Air Pollution Comes From Both Human & Natural Sources
Outdoor air pollutants can come from human, or natural sources.
Some data indicates that human sources are the main contributor to outdoor air pollution though.
… most [outdoor air pollutants] are [by products of] human sources … (ourworldindata.org)
Human Sources & Causes Of Outdoor Air Pollution
The main sources and causes of outdoor air pollution can differ depending on the geographic location, and also whether it’s a city vs a less urbanised area, in addition to whether it’s a more developed and industrialised area vs less developed and less industrialised area.
Fuel combustion from vehicles and industrial activities may be two of the more common sources.
Common Sources
… most [outdoor air pollutants] are [by products of] human sources like fuel combustion and industrial (factories, business etc.) activities (ourworldindata.org)
In Cities & Towns Specifically
[In cities and towns specifically, the main source of] air pollution is road transport (blf.org.uk)
In Developed Countries
Most of the pollution [in developed countries] is due to traffic and smog from power plants and industry (blogs.ei.columbia.edu)
General List Of Sources
A fuller list of human sources may include:
– Burning of fossil fuels [like coal, oil and natural gas] in electricity generation at power plants
From ourworldindata.org:
Coal-fired power plants are a key source of sulphur dioxide and nitrogen oxides, key precursors to ozone and particulate matter (PM) pollution
– The combustion of fuel (like petroleum and diesel) for transport (especially private motor vehicle transport)
– Activity from industry, commercial (such as office buildings, especially efficiently designed ones) and households
– Industrial processes and solvent use (e.g. chemical and mining industries)
– Agriculture
– Waste treatment (especially waste incineration)
Natural Sources & Causes Of Outdoor Air Pollutants
Natural sources may include:
Volcanic eruption
Dust blown from one location to another in the air
Sea salt spray
Emissions of volatile organic compounds from plants, or biogenic emissions from vegetation (pollen and mould spores)
Smoke from bushfires
Each Air Pollutant Can Have A Different Source/Cause
Each air pollutant:
– Is made up of different chemicals
– Can come from different activities and sources in different geographic areas
– And can have a different impact
They can also vary in concentration levels on any given day, in any given place.
Particulate Matter (PM10, & PM2.5) As An Air Pollutant
What PM Is, & What’s It Made Of?
Particulate matter … is extremely small solid particles and liquid droplets suspended in air.
The Health.NSW.Gov.Au resource outlines what chemicals and material particulate matter is made of
Where It Comes From (Sources)
Particle pollution mainly comes from motor vehicles, wood burning heaters and industry (Health.NSW.Gov.Au)
Most particles form in the atmosphere as a result of complex reactions of chemicals such as sulfur dioxide and nitrogen oxides, which are pollutants emitted from power plants, industries and automobiles. Some are emitted directly from a source, such as construction sites, unpaved roads, fields, smokestacks or fires (EPA.gov)
The friction of brakes and tyres on the road also creates particulate matter (blf.org.uk)
11 of the 12 cities with the worst PM2.5 pollution are in India.
India’s pollution comes mainly from cars, cookstoves burning coal and wood, dust storms, and forest fires.
The country’s topography also serves to trap polluted air over some areas.
– blogs.ei.columbia.edu
Pollution Trends
[There’s been a decrease of both PM 2.5 and PM 10 when considering the] national average in the US from 1980 to 2017 (EPA.gov)
[Comparatively] Particle pollution is a major air quality issue in Australia (Environment.gov.au)
Effects
Studies have linked exposure to particle pollution to a number of health problems [and vulnerable groups may involve] the very young and the elderly. Particle pollution is the major cause of reduced visibility (Environment.gov.au)
Ozone As An Air Pollutant
Also called ‘Tropospheric, or ground level ozone
Where It Comes From (Sources)
… created by chemical reactions between oxides of nitrogen (NOx) and volatile organic compounds (VOC). It is formed when pollutants emitted by cars, power plants, industrial boilers, refineries, chemical plants, and other sources chemically react in the presence of sunlight (Epa.gov)
Pollution Trends
[It has decreased based on the] national average in the US from 1980 to 2017 (EPA.gov)
Effects
Ground level ozone can [affect the airways and breathing]. People with asthma and children, older adults, and people who are active outdoors, especially outdoor workers are most at risk (EPA.gov)
Nitrogen Dioxide As An Air Pollutant
Where It Comes From (Sources)
Comes from the burning of fossil fuels like coal, oil and gas [and] Most of the nitrogen dioxide in cities comes from motor vehicle exhaust (about 80%)
[A small amount comes] from electrical storms via electrical discharge, and plants, soil and water [and] Other sources of nitrogen dioxide are petrol and metal refining, electricity generation from coal-fired power stations, other manufacturing industries and food processing.
Unflued gas heaters and cookers are the major sources of nitrogen dioxide in Australian homes
– Environment.gov.au
Pollution Trends
[Has decreased when considering the] US national average … from 1980 to 2017 (EPA.gov)
In Australia, since the early 1990s [nitrogen dioxide has been at levels thought to] be acceptable for humans (Environment.gov.au)
Effects
[Can affect the respiratory system and the lungs]. People with asthma, and in particular children and older people are most at risk (Environment.gov.au)
Carbon Monoxide As An Air Pollutant
Where It Comes From (Sources)
[Comes from the] combustion of [carbon containing] fuel such as natural gas, coal or wood [and] Vehicular exhaust contributes to the majority of carbon monoxide [roughly 50% in some years] (Wikipedia/Union Of Concerned Scientists, and NAP.edu)
Pollution Trends
[There’s been a decrease in the] carbon monoxide national average in the US from 1980 to 2017 (EPA.gov)
In most Australian towns and cities [levels are mostly below levels considered hazardous for human health, and only] some capital cities, have the potential to have harmful levels of carbon monoxide (Environment.gov.au)
Effects
Increased levels of carbon monoxide [can lead to reduced oxygen in the body], [but small increases in carbon monoxide only have minor effects]
People with heart problems are … [are] at greater risk of heart attack [and] Children and unborn babies are particularly at risk
– Environment.gov.au
Sulphur Dioxide As An Air Pollutant
Where It Comes From (Sources)
[Mainly] industrial activity that processes materials that contain sulfur, e.g. the generation of electricity from coal, oil or gas that contains sulfur. Some mineral ores also contain sulfur, and sulfur dioxide is released when they are processed (Environment.gov.au)
Sulphur dioxide can also be produced by volcanoes [but 99% comes from human sources] (Wikipedia.org)
Pollution Trends
In the US, sulfur dioxide emissions have been decreasing … (Statista.com)
Air quality regarding sulfur dioxide in improving in the US (EPA.gov)
In Australia … the highest concentrations of sulfur dioxide in the air are found around petrol refineries, chemical manufacturing industries, mineral ore processing plants and power stations … But, sulfur dioxide levels in air are not generally a problem in Australia (Environment.gov.au)
Effects
[Can impact breathing]. People most at risk [of developing problems] are those with asthma or breathing conditions (Environment.gov.au)
Other Sulphur Pollution
Different reports indicate that between 15 to 17 of the world largest container ships and super ships emit more noxious oxides (of nitrogen and sulphur) than all of the world’s car fleet put together.
Volatile Organic Compounds As Air Pollutants
What They Are
VOCs comprise volatile hydrocarbons and other organic molecules released into the atmosphere (APIS.ac.uk)
SOE.environment.gov.au list some common VOCs
Where They Come From (Sources)
In the UK it is estimated that less than 5% of … VOCs … are emitted from vegetation. The rest comes from transport, including distribution and extraction losses (50%), solvent use (30%) and other industrial processes (15%). Road transport alone accounts for 30% of VOC emissions (APIS.ac.uk)
Pesticides that are sprayed on to fields and used to fumigate soil can give off chemicals called volatile organic compounds, which can react with other chemicals and form a pollutant called tropospheric ozone. Pesticide use accounts for about 6 percent of total tropospheric ozone levels (wikipedia.org)
Pollution Trends
… concentrations of many VOCs are consistently higher indoors (up to 10 times higher) than outdoors ( SOE.environment.gov.au)
Effects
Different VOCs have different health effects, and range from those that are highly toxic to those with no known health effect … (SOE.environment.gov.au)
Indoor Air Pollution Contributing To Outdoor Air Pollution
who.int indicates that indoor air pollution in the form of smoke for example can leak outside and contribute to outdoor air pollution.
It’s worth noting that some regions in the world with both poor indoor and outdoor pollution levels may suffer from both issues.
Impact Of Outdoor Air Pollution On Human Health
General Impact, & Pollutant Specific Impact
The impact of outdoor air pollution on human health can be a general impact, but also the impact of each different air pollutant.
We wrote about the potential human health impact of each pollutant in the pollutant profiles above in this guide.
But, for both, there might be 3 main types of linked or attributable human health impacts to consider:
– Attributable deaths/mortality rate
– Attributable health conditions and diseases (such as respiration conditions, cancers, lung disease, cardiovascular disease), and impairment of functioning of the body, such as breathing, visibility, etc.
– Groups that might be most vulnerable, or most at risk from exposure to outdoor air pollution
It’s also possible that some pollutants have no impact on human health.
Number Of Deaths Per Year Attributable To Outdoor Air Pollution, & Which Health Conditions They Are Related To
Worldwide, ambient air pollution contributes to 7.6% of all deaths in 2016 (who.int)
Some 3.8 million premature deaths annually are attributed to outdoor (ambient) air pollution.
About 80% of those deaths are due to heart disease and stroke, while another 20% are from respiratory illnesses and cancers related to exposure to fine particulate matter (PM2.5)
– who.int
The World Health Organization estimate that 3 million people die from ambient outdoor pollution every year (ourworldindata.org)
Challenges In Attributing Air Pollution To Deaths, & Health Conditions & Diseases
Some also question how strongly air pollution can be attributed to certain deaths, health conditions and diseases.
At the least, there might be challenges in attributing air pollution to these things.
Variables like pre-existing conditions can play a role, just as one example.
A ‘death’ from air pollution is defined as someone who dies prematurely (could be in the range of months or years) than would be expected in the absence of air pollution]
In many cases, air pollution exacerbates pre-existing cardiorespiratory illnesses—individuals suffering from asthma, for example, are particularly vulnerable.
– OurWorldInData, and StateOfGlobalAir.org
Groups That Might Be Most At Risk, Or Most Vulnerable To Outdoor Air Pollution
Some of the people that might be most at risk might be:
Those who spend a lot of time outdoors
People living in areas close to air pollutant emitting sources (e.g. people living near smog producing power plants, industrial sites, highways, or near areas where there is a lot of carbon monoxide pollution from transport
Low to middle income communities living in areas where air pollution is already at unsafe levels (this is especially the case if these people can’t afford to move)
People living in countries or cities with a history of hazardous air pollution levels
People with pre existing health conditions (like asthma and other conditions affecting the airways, respiratory system and lungs)
Children under 5
The elderly
[ … neighbourhoods, cities and people might be at more risk if they are] sited near environmental hazards, such as highways, power plants, and industrial complexes
– who.int
Lower income and developing areas, as well as children might be most at risk:
The problem is even more acute in the developing world … Children under age 5 in lower-income countries are more than 60 times as likely to die from exposure to air pollution as children in high-income countries
– wikipedia.org
Air Pollution As Potentially The Greatest Environmental Risk To Human Health Right Now
It’s also worth noting that The World Health Organisation (WHO) highlights air pollution as the greatest environmental risk to human health at the moment
Note that this is based on current risk, and that longer-term environmental threats such as a changing climate may be more of a risk in the future
What Is The Most Harmful Outdoor Air Pollutant For Humans & Human Health?
Fine particulate matter might be the most harmful pollutant i.e. PM2.5, but particulate matter in general might be the most harmful as a pollutant over other pollutants
Ozone might also have some concern
The data by ourworldindata.org also backs up the data elsewhere in this guide that outdoor air pollution
… fine particulate matter (PM2.5) [is] the most health-harmful air pollutant [and, a major reason is that it can cause premature death in humans exposed to it via respiratory illnesses and cancers]
Ground-level ozone … is another health risk, raising rates of asthma and chronic respiratory illness as well as other sorts of breathing problems and reduced lung function
– who.int
The three key sources of air pollution deaths are from the indoor burning of solid fuels (indoor air/household pollution), exposure to ambient outdoor ozone (O3), and ambient outdoor particulate matter (PM) pollution.
In 2015, premature deaths linked to these 3 pollutants were as follows (as total %’s):
Particulate Matter – 57.54%
Indoor Air Pollution/Solid Fuels – 38.72%
Ozone – 3.45%
– ourworldindata.org
Comparing Attribution To Premature Human Deaths For Outdoor Air Pollution vs Indoor Air Pollution
Several sources indicate that outdoor air pollution contributes to/is linked to more premature deaths than indoor air pollution right now.
According to ourworldindata.org: ‘It’s estimated [air pollution contributes to] seven million premature deaths every year (4.3 million from ambient outdoor pollution, and 2.6 from households)
According to who.int:
Exposure to outdoor air pollution results in 4.2 million deaths every year
Exposure to smoke from dirty cookstoves and fuels in households indoors results in 3.8 million deaths every year
Environmental Impact Of Outdoor Air Pollution
[In addition to human health] Outdoor air pollution can [also] damage ecosystems, food crops and the built environment (OurWorldInData/WHO)
Air pollutants like nitrogen dioxide, and sulfur dioxide also mix with other pollutants and compounds, and water, to contribute to acid rain, and this contributes to the acidification of natural water sources and soils.
Economic Impact Of Outdoor Air Pollution
Some estimates indicate air pollution may cost economies trillions of dollars.
Air pollution [as a whole] costs the world economy $5 trillion per year as a result of productivity losses and degraded quality of life (wikipedia.org)
Overall Impact Of Air Pollution On Society
Overall, there can be an impact on humans and human health, wild life and living organisms, plant life and the environment, and the economy.
Air pollution can also impact aesthetics of cities with the appearance of smog and unsightly air.
The Relationship Between Air Pollution And Agriculture/Food Production
There is a relationship between agriculture/food production and air pollution.
Agriculture is responsible for the release of compounds that can react and form air pollutants.
On the other hand, there’s some evidence that air pollution impacts the yields, productivity, soil quality and other aspects of agriculture and food production.
Agriculture’s Contribution To Air Pollution
Agricultural air pollution comes mainly in the form of ammonia (NH3), which enters the air as a gas from heavily fertilized fields and livestock waste.
It blows in over cities, reacts with emissions of oxides of nitrogen (NOx) and sulphur (SO2) from traffic and industry, and leads to the formation of … secondary particles
– airclim.org
Agriculture is the single largest contributor of ammonia pollution as well as emitting other nitrogen compounds … [and] This affects soil quality and thus the very capacity of the soil to sustain plant and animal productivity (unece.org)
How Air Pollution Impacts Agriculture
… there is increasing evidence that food production is also threatened by air pollution.
Ozone precursor emissions (nitrogen oxides and volatile organic compounds) are of particular concern for global food security as these compounds react to form ground-level ozone.
This, in turn, penetrates into the plant structure and impairs its ability to develop
– unece.org
In India in 2014, it was reported that air pollution by black carbon and ground level ozone had reduced crop yields in the most affected areas by almost half in 2011 when compared to 1980 levels (wikipedia.org)
Ozone also [has the ability to impact] crop productivity (who.int)
How Many Cities Worldwide Have ‘Unacceptable’ Levels Of Polluted Outdoor Air?
From the numbers below, these estimates indicate that potentially only 10 to 20% of cities have air quality levels within acceptable guidelines.
The sample size should be taken into consideration though obviously, and also how estimates were calculated.
It’s also worth noting that when looking at all forms of air pollution (indoor and outdoor), majority of pollution-related deaths were in Asia – South, Southeast and East Asia in 2016
Estimates Of Cities & Locations With Potentially ‘Unacceptable Levels’ Of PM2.5 Pollution
[From a survey with a sample size of] 4300+ cities worldwide, only 20% of the urban population surveyed live in areas that comply with WHO air quality guideline levels for PM2.5.
Average particulate air pollution levels in many developing cities can be 4-15 times higher than WHO air quality guideline levels, putting many at risk of long-term health problems
– who.int
The interactive who.int map in the sources list indicates that ‘91% of the world’s population lives in places where air quality exceeds WHO guideline limits’
Eighty-five percent of European urban dwellers are exposed to particulate matter at levels higher than what WHO considers safe (blogs.ei.columbia.edu)
In Which Geographic Regions Do Most Air Pollution Attributed Deaths Happen?
When looking at all forms of air pollution (outdoor and indoor) …
According to ourworldindata.org:
… majority of pollution-related deaths are in Asia – South, Southeast and East Asia alone accounted for nearly 3 million in 2016.
You can read more about air pollution related deaths by type, country and more here (ourworldindata.org)
Countries, Cities & Regions With The Most Outdoor Air Pollution
The level of air pollution in a city is one of the factors that contributes to how sustainable or green a city is.
Air pollution, and specifically the concentration of each air pollutant in the air, differs between geographic locations.
Indian cities, followed by Chinese cities may be some of the most polluted in terms of PM2.5 concentrations
Pakistan, parts of Africa, parts of the Middle East, and parts of South East Asia may also have cities with higher than average air pollution when it comes to PM2.5
Regions With The Most Particular Matter 2.5 Air Pollution
India, Pakistan, China, and parts of Africa feature in the top regions
Based on the amount of particulate matter under 2.5 micrograms found in every cubic metre of air, Indian regions and cities are the most polluted in the world in 2018, followed by China.
Some places in Saudi Arabia are also highly polluted
– WeForum.org
Egypt, Mauritania, Libya, Niger, Cameroon and Pakistan also show high mean annual averages of migrograms per cubic meter of PM 2.5 air pollution in 2015
– ourworldindata.org
11 of the 12 cities with the worst PM2.5 pollution are in India (blogs.ei.columbia.edu)
There’s also two maps that outline the regions with the worst outside air pollution – these maps are available at waqi.info, and maps.who.int
They mainly focus on particulate matter pollution levels
Regions With The Least PM2.5 Pollution
Some of the least polluted countries in the world in terms of mean annual averages of migrograms per cubic meter of PM 2.5 air pollution in 2015 are Kirbati, Samoa, Brunei, Solomon Islands, Sweden, Finland, Australia, Canada, United States, New Zealand, Norway, Spain, and Iceland (ourworldindata.org)
US States With The Most Air Pollution, & Least Air Pollution
In this guide, we look at the US States which might have some of the most and least polluted air.
Understanding Air Quality & Air Quality Indexes
Read more about air quality, how it’s measured, and Air Quality Indexes in this guide.
How To Reduce Outdoor Air Pollution – Potential Solutions
Potential Solutions & Strategies
– Look at the main sources of each major pollutant, and reverse engineer strategies to reduce emissions from these sources
Cities can look at the major pollutants in their area, and look at the major sources that each pollutant is coming from.
We’ve summarised some of those potential sources for each pollutant in the pollutant profiles above in this guide.
As a summary, some of the main pollutants to look at might include:
Particulate matter (PM2.5, and PM10) – PM2.5 is one of the main pollutants that is linked to premature human deaths related to air pollution
Ozone (O3)
Nitrogen dioxide (NO2)
Sulfur dioxide (SO2)
Particulate matter (particularly fine particulate matter) is one of the most commonly emitted air pollutants, and may have one of the greatest impacts.
But ozone, nitrogen dioxide, and sulfur dioxide are others too, and the most common pollutants can differ between geographic regions.
So, each geographic area should have an analysis of the most common pollutants during any one time period to identify which ones to focus on, and impact of each pollutant should also be taken into account.
– Use cleaner energy sources, and be more efficient with energy use
Some energy sources are responsible for more pollutant emissions than others.
Cleaner energy source types can be used (such as switching from fossil fuel based energy sources to renewable or low pollutant footprint sources), and pollutant catchment devices (such as particulate matter filters) can be used for electricity generation
Additionally, energy and electricity can be used more efficiently
Retrofitting buildings with more energy efficient designs and equipment, and introducing programs to encourage the saving of energy can be options
Some residents and building owners may also start sourcing more energy off grid from renewable energy such as solar panel set ups
– Using cleaner fuels for transport, and more sustainable vehicle designs and features
Cleaner fuels may be used for transport such as personal use vehicles
For example, hybrid vehicles may be used over traditional combustion vehicles that use petroleum and diesel fuels
Cities in particular and heavily populated places with more passenger cars and private vehicles on the road is where transport pollution can be the heaviest
Focus on the main polluting sources of transport – which tend to be road transport such as cars and trucks. But, in addition to road, look at reductions air, water, rail, and so on
Consider the impact of freight/shipping transport pollution, and not just personal transport [when looking at greenhouse gas emissions, freight transport can make up as much as 41% of emissions in some countries – so, it’s likely air pollution numbers could be similar]
Other points:
Consider how hybrid, electric vehicles, hydrogen vehicles and other alternative fuel vehicles can be used most effectively, and how they can become more feasible to use long term
Consider how effective redesigns and new features like regenerative braking and fuel efficiency can be beneficial
Focus on pollution rates per passenger mile travelled as another key statistic – different modes and models of transport have different rates to be aware of (fuel and passenger efficiency of transport is important in this regard)
Focus on the operation/use stage of transport, as this is where a significant portion of pollution occurs. But, also look for opportunities to reduce pollution at the other stages such as mining and sourcing of materials, fabrication and manufacture, disposal and recycling etc. for opportunities for pollution reduction
Maintain and improve vehicle emission and air quality standards, policies, regulations and legislation
Inform and educate the public on how they can personally reduce pollution and emissions buy using cars less, driving less, maintaining their vehicles, buying ‘greener’ cars and knowing what to look for etc. And, have some way for governments or third party organisations to relay to the public progress of transport pollution over time
More efficient energy and fuel (that gets similar output for less energy used)
Improved design on vehicles that helps with efficient burning of fuel (engine, tires, aerodynamics, etc), as well as keeping cars maintained
– Reducing the use of personal vehicles in favor of more efficient transport, and lower footprint transport
For example, public transport and bicycles and walking can have a lower pollution footprint (such as lower per passenger air pollution footprints) than private passenger vehicles
Encouraging the use of bikes and car sharing may be other strategies
– Consider the benefit of regulations and standards for vehicles
Regulations and policies to support air pollution control
Vehicle emission standards have helped cut pollution from cars and trucks by about 90 percent since 1998, with further improvements coming from the Tier 3 standards (ucsusa.org)
– Consider the benefit of general air pollution regulations on minimum air quality that has to maintained for citizens
11 of the 12 cities with the worst PM2.5 pollution are in India.
[In India, while] anti-pollution laws exist, they are weakly enforced
– blogs.ei.columbia.edu
– Improving city infrastructure, planning and public transit systems
Some cities have a fixed city plan and infrastructure
But, some cities have the ability to improve city planning, infrastructure and transport systems to be more efficient and have a better sustainability footprint
Re-designing inner city and urban area for less traffic congestion, less built up traffic, more efficient driving without as much stopping, starting, braking and acceleration may be examples
Consider how urban and CBD areas can be more friendly to walking, biking and public transport
– Consider overall consumption rate
Using cleaner energy and fuel are some solutions to consider, along with more efficient consumption (such as consumption per capita)
But, total consumption needs to be considered as well
Reducing the total number of vehicles, reducing distance travelled, and reducing the amount of fuel being used per year will all likely lower emissions more significantly than switching to alternate fuel sources
Consumption rate, rate of industrialisation, population growth, consumption intensity (of each type of energy or fuel for example), and total consumption all play
One example of this is looking at the total amount of cars on the road from year to year, and looking at the total number of miles driven each year, as opposed to just looking at the type of fuel vehicles are using
– Adding plantlife, tree cover and greenery to cities
Have the ability to be able to improve air quality through various measures
Trees and vegetation for example might be able to absorb toxins and help purify air
– Other potential solutions
Focus specifically on heavily populated cities, cities with high numbers of vehicles, and cities and regions with high rates of industrialisation of power plants and other industrial or commercial operations that use energy and emit pollutants. This is in comparison to less populated, less industrialised regions
Implement better standards for vehicle fuel efficiency and pollutant emission rates
Improving energy efficiency of households and buildings
Improving waste management to reduce air pollution
Improving energy efficiency in both power plants and business/industry/commercial sectors
Making agriculture cleaner and more sustainable to reduce air pollution from fertilizers and other synthetic chemicals
Using air pollution control devices in industry and transport – particulate control (precipitators, baghouses, scrubbers, collectors), scrubbers, NOx control, VOC abatement, Acid gas control, mercury control, dioxin control and so on
Where it is hard to reduce emissions significantly from or in any one activity, process or geographic locations, people may look to move to areas where the air is cleaner and better quality for breathing in. For lower income and poorer neighborhoods and groups of people, this is obviously a major issue they may not be able to address themselves, and they will need some type of external (government assistance, private project funding, or something else) to help them with a viable solution to air pollution problems that could be a threat to their health if they stay where they are.
Consider how air travel can become more sustainable to reduce air pollution in the future, and consider how sustainable aviation fuels might play a part
Effectiveness & Return On Investment Of Pursuing Different Air Pollution Reduction Strategies
Some reports indicate that there may be better return of investment on, and better potential to be effective with allocating resources towards cleaner stationary power at power plants first, rather than focussing on trying to improve mobile transport vehicles first
So, where we place focus and how intensely we pursue solutions in each area could be key for short to medium term results.
Examples Of Cities That Have Already Reduced Air Pollution, & What Solutions They Implemented
Cities That Have Reduced Air Pollution
There are cities worldwide that have already reduced air pollution with various strategies.
theguardian.com indicates that Paris, Delhi, Netherlands, Freiburg, Copenhagen, Oslo, Helsinki, Zurich, Curitiba and Bangalore are all cities that have done something to address and reduce air pollution.
Cities in Spain, Portugal, Canada, Colombia and South Korea have also seen some sizeable reductions.
According to weforum.org, Zabol may have cut it’s air pollution too:
‘The most polluted city in a 2016 report, Zabol in Iran, has had its pollution level cut fourfold in the latest version of the database, and now appears to be cleaner than Australia’s capital Canberra’
Solutions & Strategies Implemented By Cities To Reduce Air Pollution
Some of the solutions that have enabled these cities to achieve these reductions involve:
Adding plantlife, tree cover and greenery
Reducing the use of personal vehicles (especially those that use fossil fuel like petrol and diesel)
Substituting some fossil fuel vehicles with electric vehicles
Introducing better public transit systems
Encouraging the use of bikes and car sharing
Retrofitting buildings with more energy efficient designs and equipment
Introducing programs to encourage the saving of energy
A summary of specific cities and what they did to reduce air pollution, paraphrased from talkofthecities.iclei.org:
– Vitoria-Gasteiz, Basque Country, Spain
Reduced air pollution emissions by 63%.
They added plants and greenery, reduced vehicle use, and retrofitted buildings
– Montréal, Canada
Reduced air pollution emissions by 54%.
They increased tree cover and are reducing fossil fuel using vehicles
– Lisbon, Portugal
Reduced air pollution emissions by 50%.
They decreased vehicle usage, as well as started to switch over to electric vehicles
– Medellín, Colombia
Reduced air pollution emissions by 33%.
Increased greenery, introduced better transit system, and bike and car sharing projects.
– Seoul, Korea
Reduced air pollution emissions by 28%.
Introduced a program providing incentives based on the amount of energy saved
Air Pollution Trends Over Time – Increasing Or Decreasing?
What might be extrapolated from the data on trends below:
– Total global deaths attributable to outdoor air pollution have increased in the last few decades, but because the world population has increased over the same time, death rates have actually decreased across countries of all income levels by some estimates of up to 50%
– An exception to the above might be some low to middle income cities
– Apart from general air pollution, individual pollutant trends can be measured over time too
Death Rates Attributed To Outdoor Air Pollution Over Time
Death rates from air pollution—across countries of all income levels [have declined over the] last few decades … [usually] by more than 50 percent.
Globally, it’s estimated that outdoor air pollution resulted in 4.2 million deaths in 2016; this represents an increase from 3.4 million in 1990 [however, it should be considered that the global population has increased in that time]
– ourworldindata.org
Low To Middle Income Cities
[In some] low to middle income cities … air pollution has become worse over the past several years (who.int)
Trends By Individual Air Pollutants Over Time
OurWorldInData also shows levels of the different levels of different air pollutants over the years.
You can see that there was a huge increase up until 1970/1980 for most regions, followed by a steady decline (ourworldindata.org)
Although some pollutants have decreased since 1980, there has been small increases or flatlines in progress in the years before 2017.
Particulate matter 10 levels are one example of this – with minimal progress being made since 2004.
The US has seen a decrease in PM 10 and 2.5 from 1980 to 2017.
Sources
1. Hannah Ritchie and Max Roser (2018) – “Air Pollution”. Published online at OurWorldInData.org. Retrieved from: ‘https://ourworldindata.org/air-pollution’ [Online Resource]
2. http://www.health.nsw.gov.au/environment/air/Pages/outdoor-air-pollution.aspx
3. https://www.blf.org.uk/support-for-you/air-pollution/where-does-it-come-from
4. https://www.environment.nsw.gov.au/topics/air/monitoring-air-quality
5. http://www.environment.gov.au/protection/publications/factsheet-sulfur-dioxide-so2
6. http://www.environment.gov.au/protection/publications/factsheet-nitrogen-dioxide-no2
7. https://en.wikipedia.org/wiki/Air_pollution
8. https://archive.epa.gov/ozonedesignations/web/html/faq.html#whatisozone
9. https://www.climatechangeinaustralia.gov.au/en/climate-campus/climate-system/greenhouse-gases/
10. http://www.health.nsw.gov.au/environment/air/Pages/particulate-matter.aspx
11. https://www.epa.gov/pm-pollution/particulate-matter-pm-basics#PM
12. https://www.nap.edu/read/10378/chapter/3
13. http://www.apis.ac.uk/overview/pollutants/overview_VOCs.htm
14. https://www.statista.com/statistics/501303/volume-of-sulfur-dioxide-emissions-us/
15. https://www.epa.gov/air-trends/sulfur-dioxide-trends
16. https://www.epa.gov/air-trends/nitrogen-dioxide-trends
17. https://www.statista.com/statistics/501284/volume-of-nitrogen-oxides-emissions-us/
18. https://www.epa.gov/air-trends/ozone-trends
19. https://www.epa.gov/air-trends/carbon-monoxide-trends
20. https://www.epa.gov/air-trends/particulate-matter-pm25-trends
21. https://www.epa.gov/air-trends/particulate-matter-pm10-trends
22. https://www.dec.ny.gov/chemical/66472.html
23. https://www.epa.gov/ozone-pollution/health-effects-ozone-pollution
24. http://www.environment.gov.au/protection/publications/factsheet-carbon-monoxide-co
25. https://soe.environment.gov.au/theme/ambient-air-quality/topic/2016/volatile-organic-compounds
26. https://www.weforum.org/agenda/2018/05/these-are-the-worlds-most-polluted-cities
27. https://www.who.int/sustainable-development/cities/health-risks/air-pollution/en/
28. https://www.eea.europa.eu/themes/air/air-pollution-sources
29. https://www.bettermeetsreality.com/how-to-reduce-solve-air-pollution-with-examples-of-cities-that-have-already-done-it/
30. https://www.bettermeetsreality.com/countries-cities-with-the-worst-ambient-outdoor-air-pollution-household-indoor-air-pollution/
31. https://www.who.int/airpollution/en/
32. https://www.bettermeetsreality.com/what-level-of-air-quality-pollution-is-safe-for-us-to-breathe-live-in/
33. https://www.unece.org/environmental-policy/conventions/envlrtapwelcome/cross-sectoral-linkages/air-pollution-and-food-production.html
34. http://www.airclim.org/acidnews/agriculture-major-cause-air-pollution
35. https://www.bettermeetsreality.com/impact-of-transport-vehicles-on-the-environment/
36. https://en.wikipedia.org/wiki/Environmental_impact_of_pesticides#Air
37. http://www.pollutionissues.com/Ve-Z/Vehicular-Pollution.html
38. https://en.wikipedia.org/wiki/Environmental_impact_of_transport
39. https://www.ucsusa.org/clean-vehicles/vehicles-air-pollution-and-human-health#.XGIFv-IzbR0
40. https://www.epa.vic.gov.au/your-environment/air/vehicle-emissions-and-air-quality
41. https://sciencing.com/effects-car-pollutants-environment-23581.html
42. https://www.who.int/airpollution/ambient/interventions/en/
43. http://talkofthecities.iclei.org/how-these-five-global-cities-have-improved-their-air-quality/
44. https://en.wikipedia.org/wiki/Air_pollution#Reduction_efforts (includes how we can reduce air pollution, and practical alternatives to the principal causes of air pollution)
45. https://www.theguardian.com/environment/2016/may/17/how-are-cities-around-the-world-tackling-air-pollution
46. https://www.who.int/news-room/fact-sheets/detail/ambient-(outdoor)-air-quality-and-health
47. https://waqi.info/
48. https://blogs.ei.columbia.edu/2018/06/26/air-quality-alerts-pollution/
49. https://www.who.int/gho/phe/outdoor_air_pollution/burden/en/
50. https://www.who.int/airpollution/ambient/interventions/en/ (solutions to outdoor air pollution)
51. https://en.wikipedia.org/wiki/List_of_most-polluted_cities_by_particulate_matter_concentration
52. http://maps.who.int/airpollution/
53. https://blogs.ei.columbia.edu/2018/06/26/air-quality-alerts-pollution/
54. https://www.economist.com/finance-and-economics/2017/03/11/green-finance-for-dirty-ships
55. https://cedelft.eu/publications/the-basic-facts-how-do-the-emissions-of-ships-and-cars-really-compare/
','' ); } ?>